Monitoring
Dragonfly is recommending to use prometheus for monitoring. Prometheus and grafana configurations are maintained in the dragonflyoss/monitoring repository.
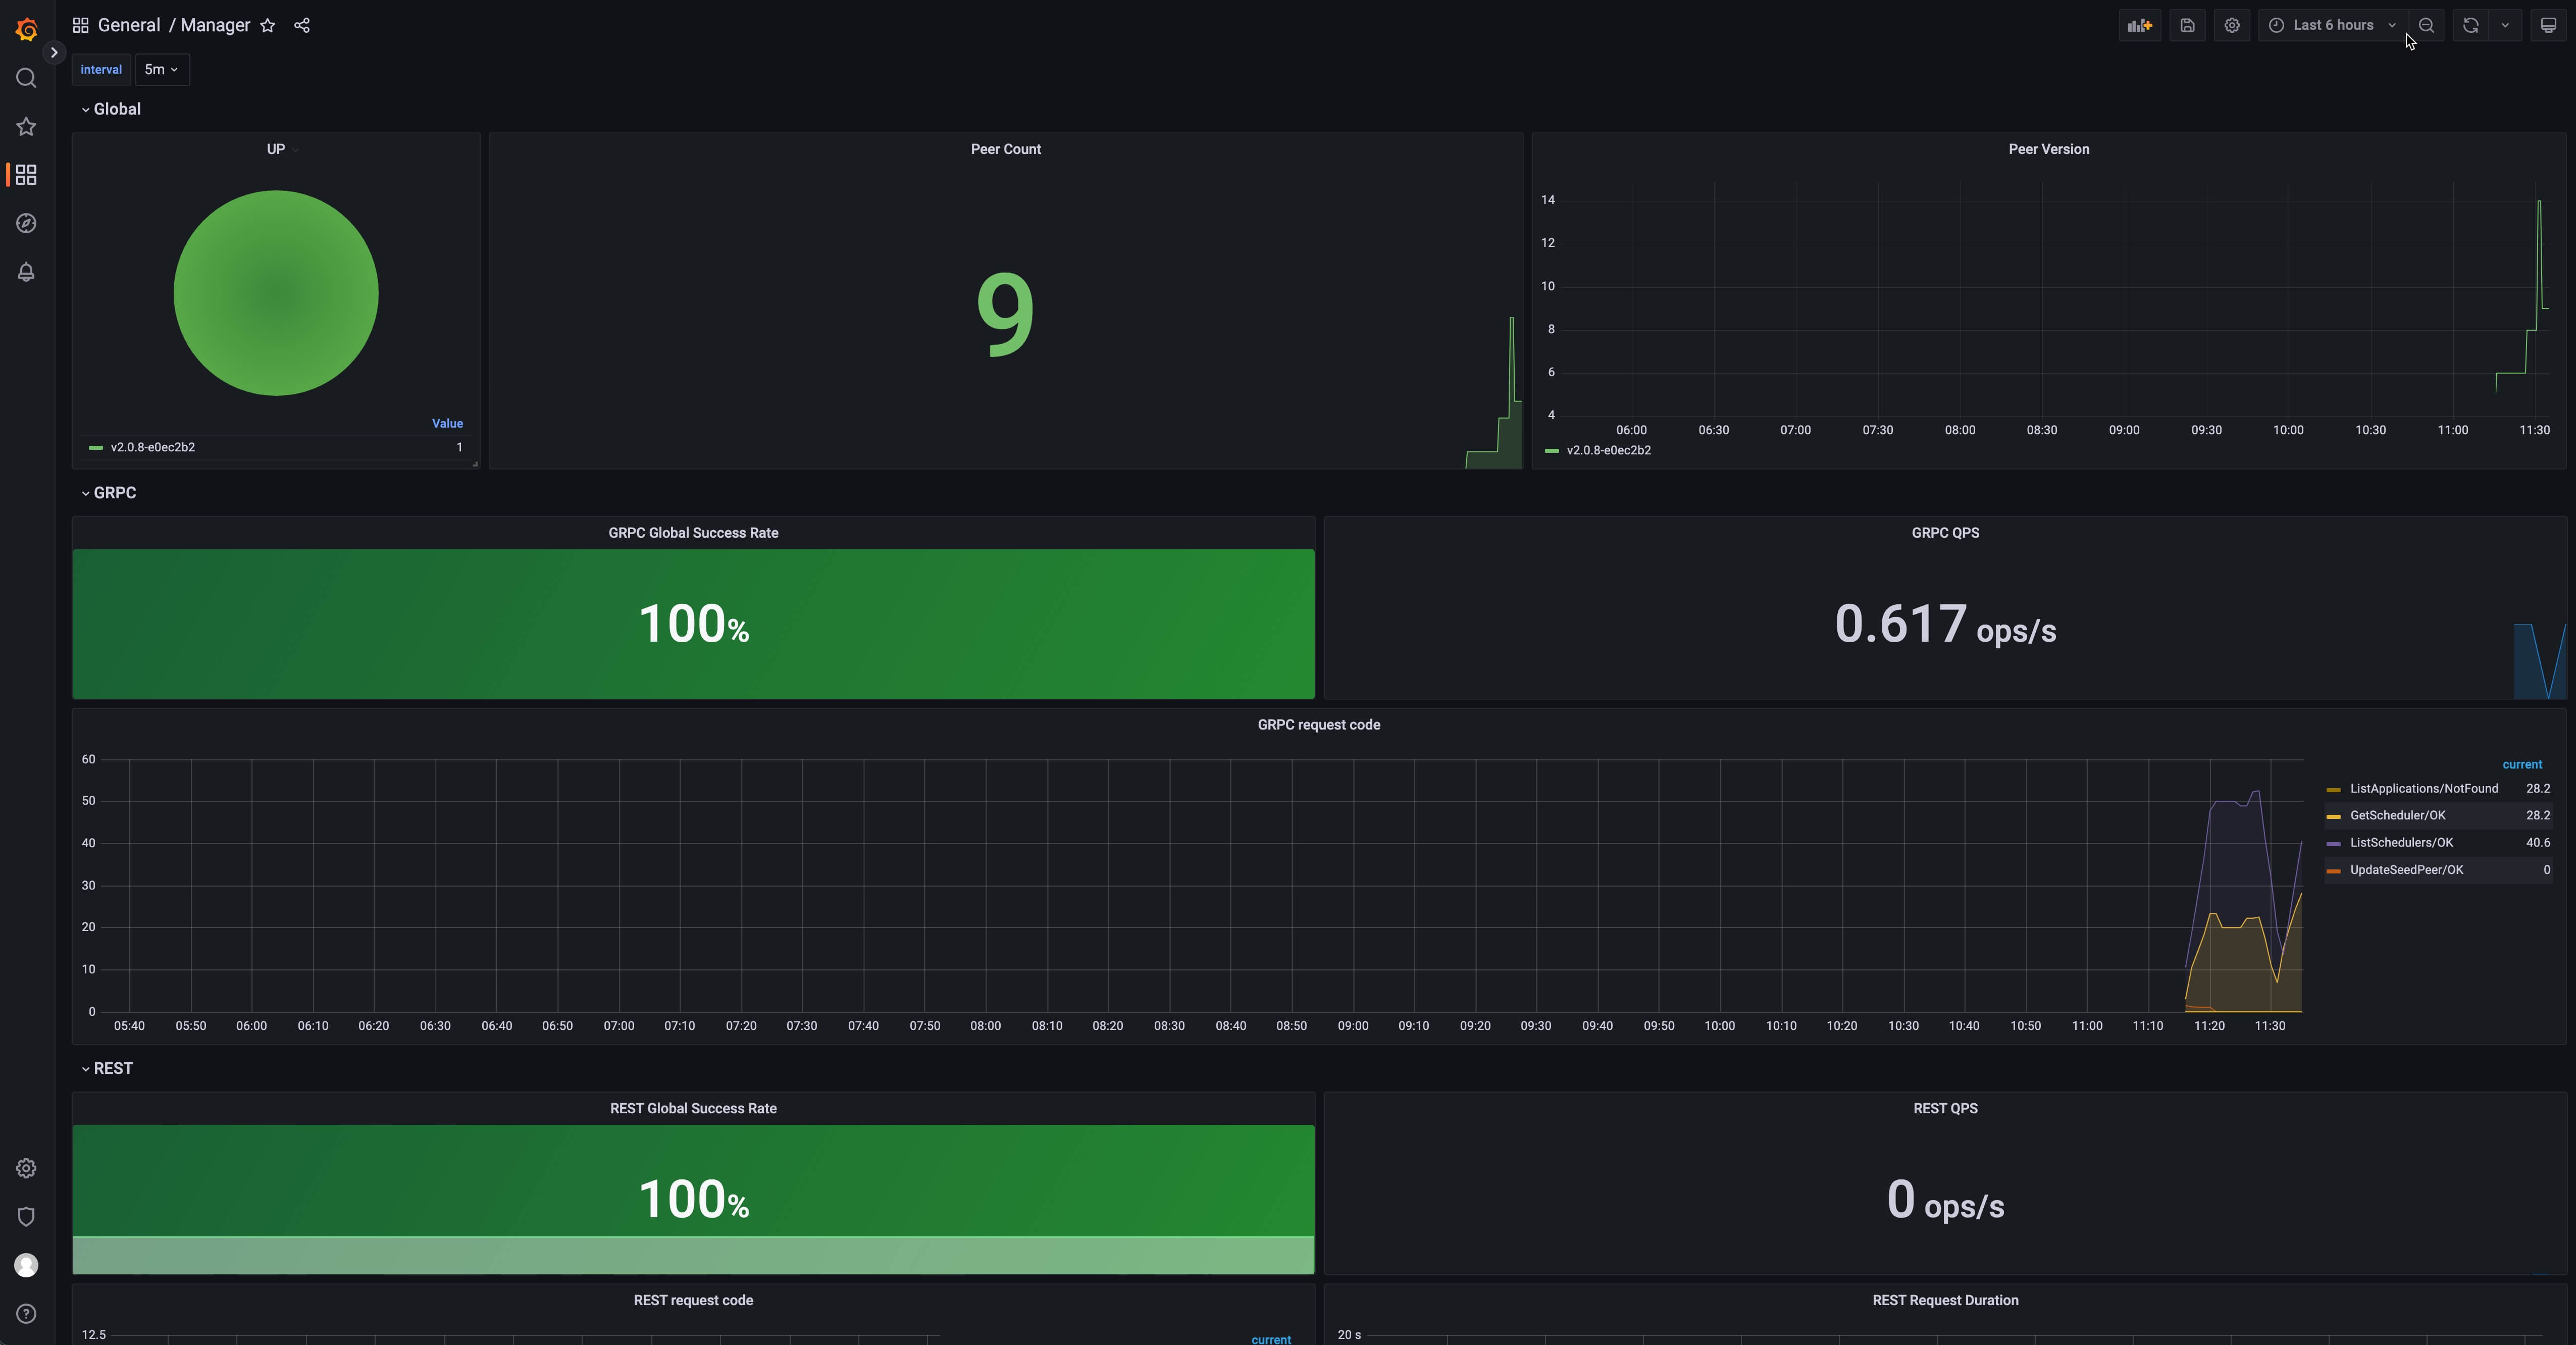
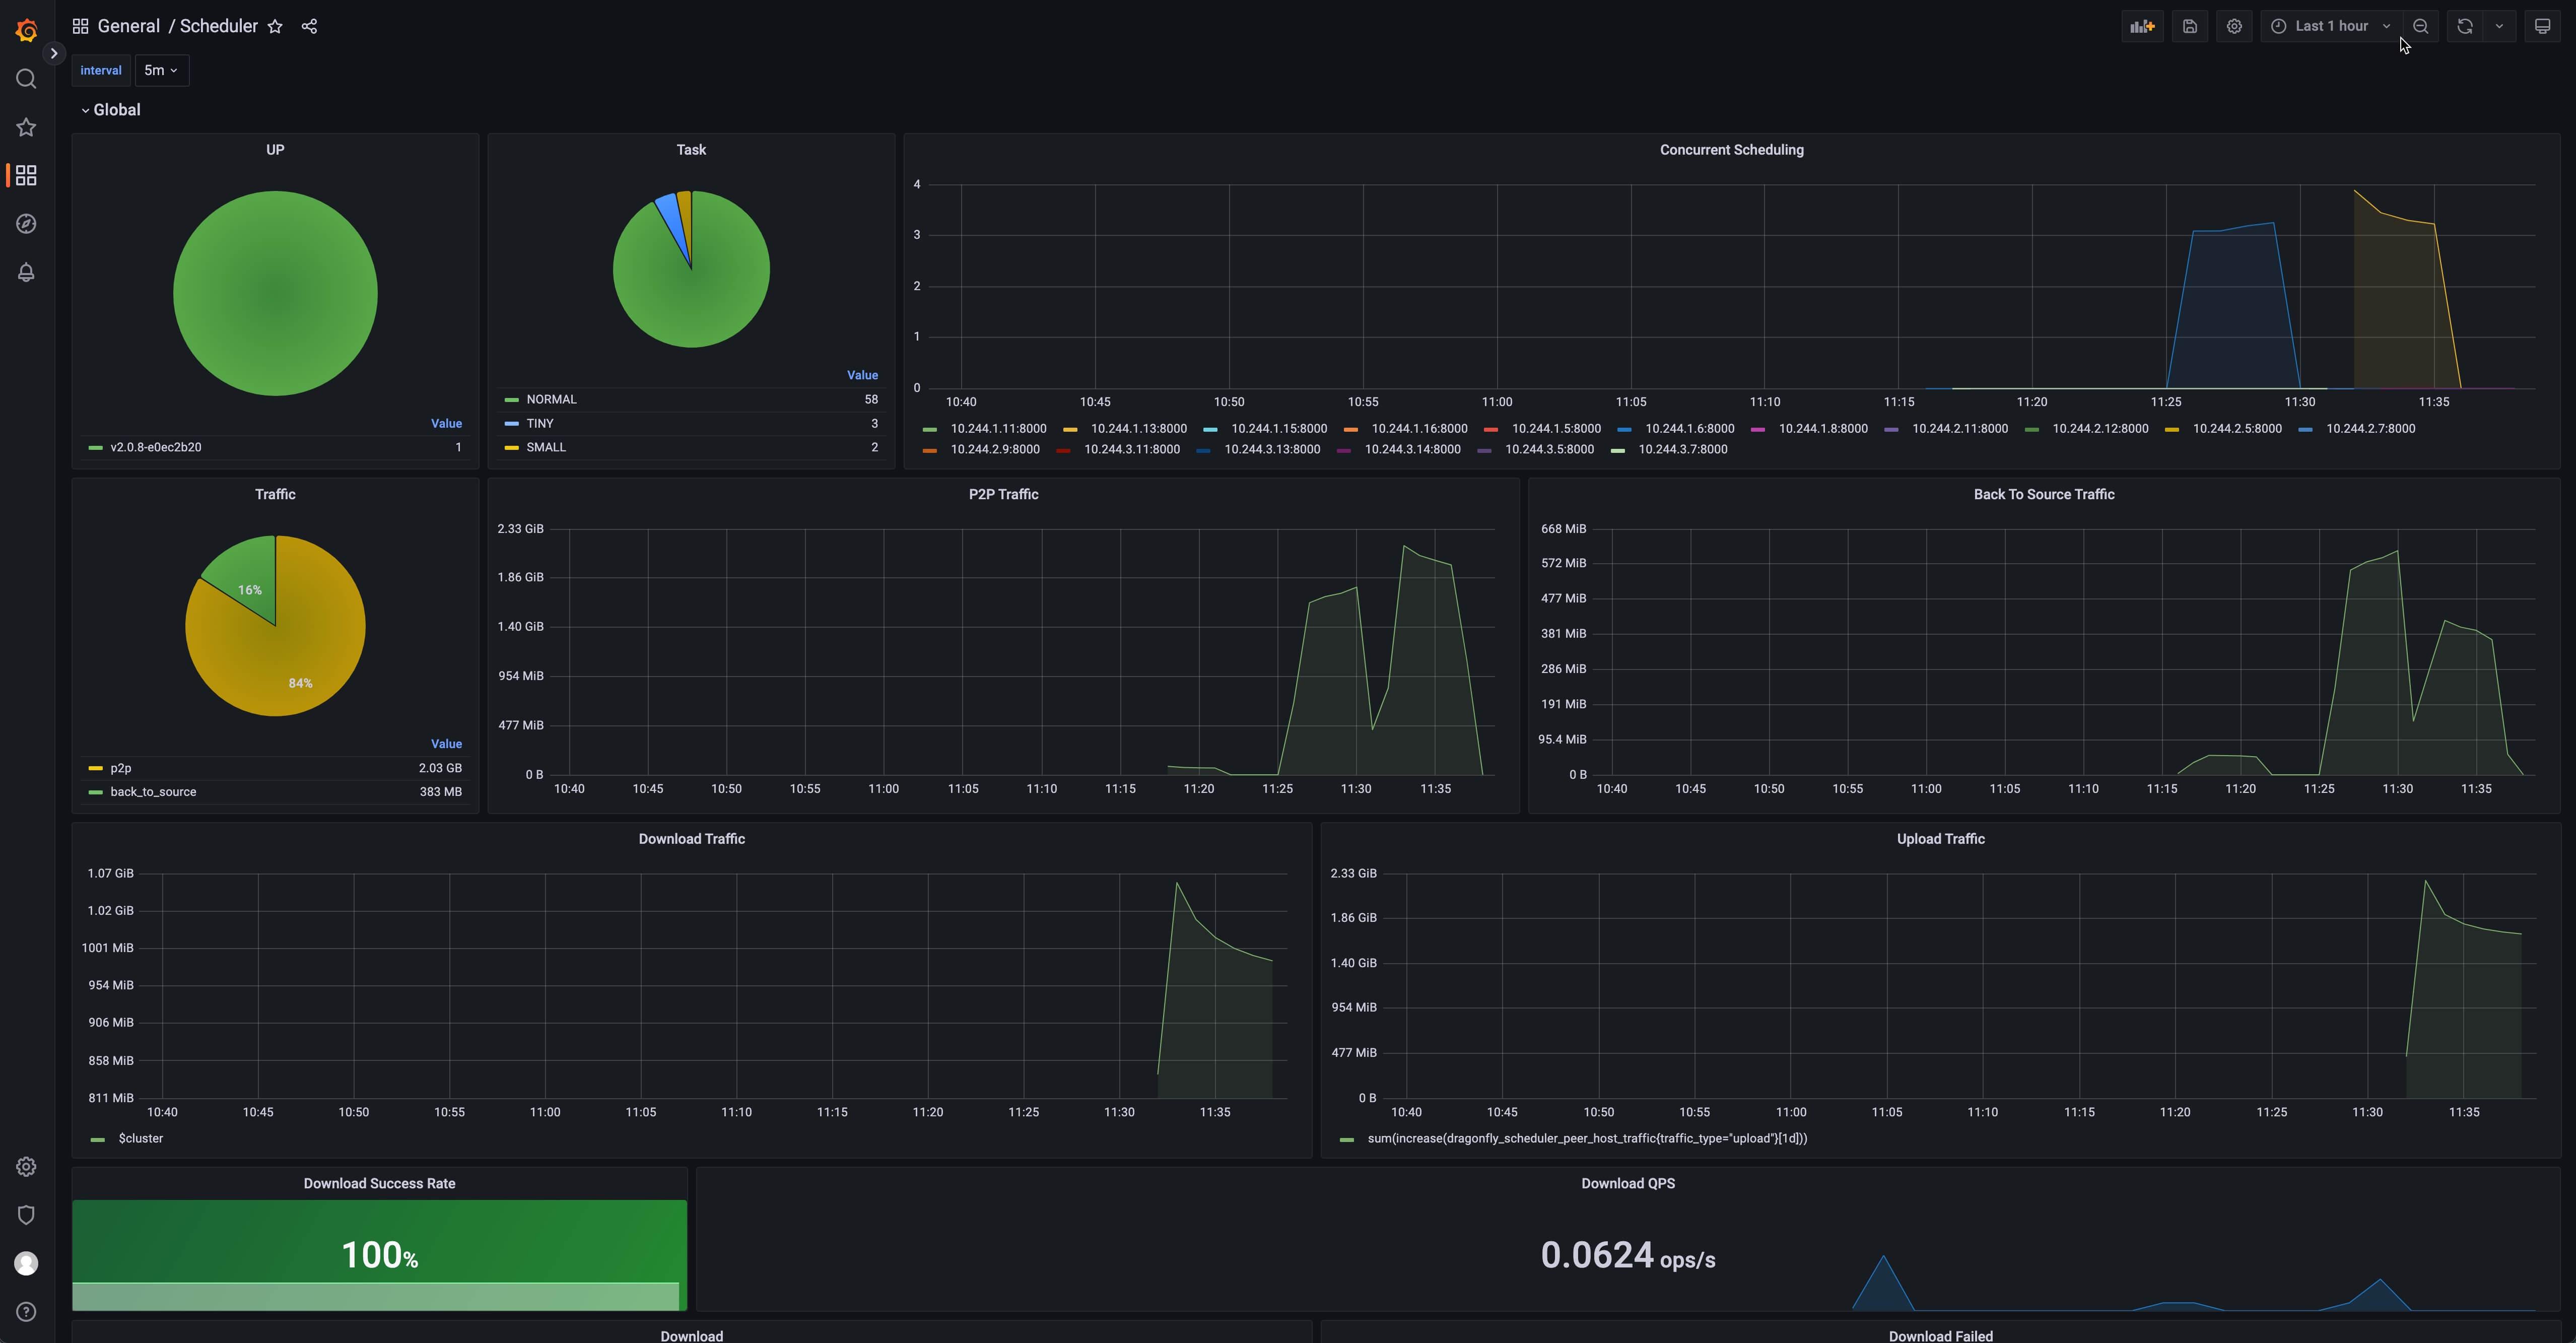
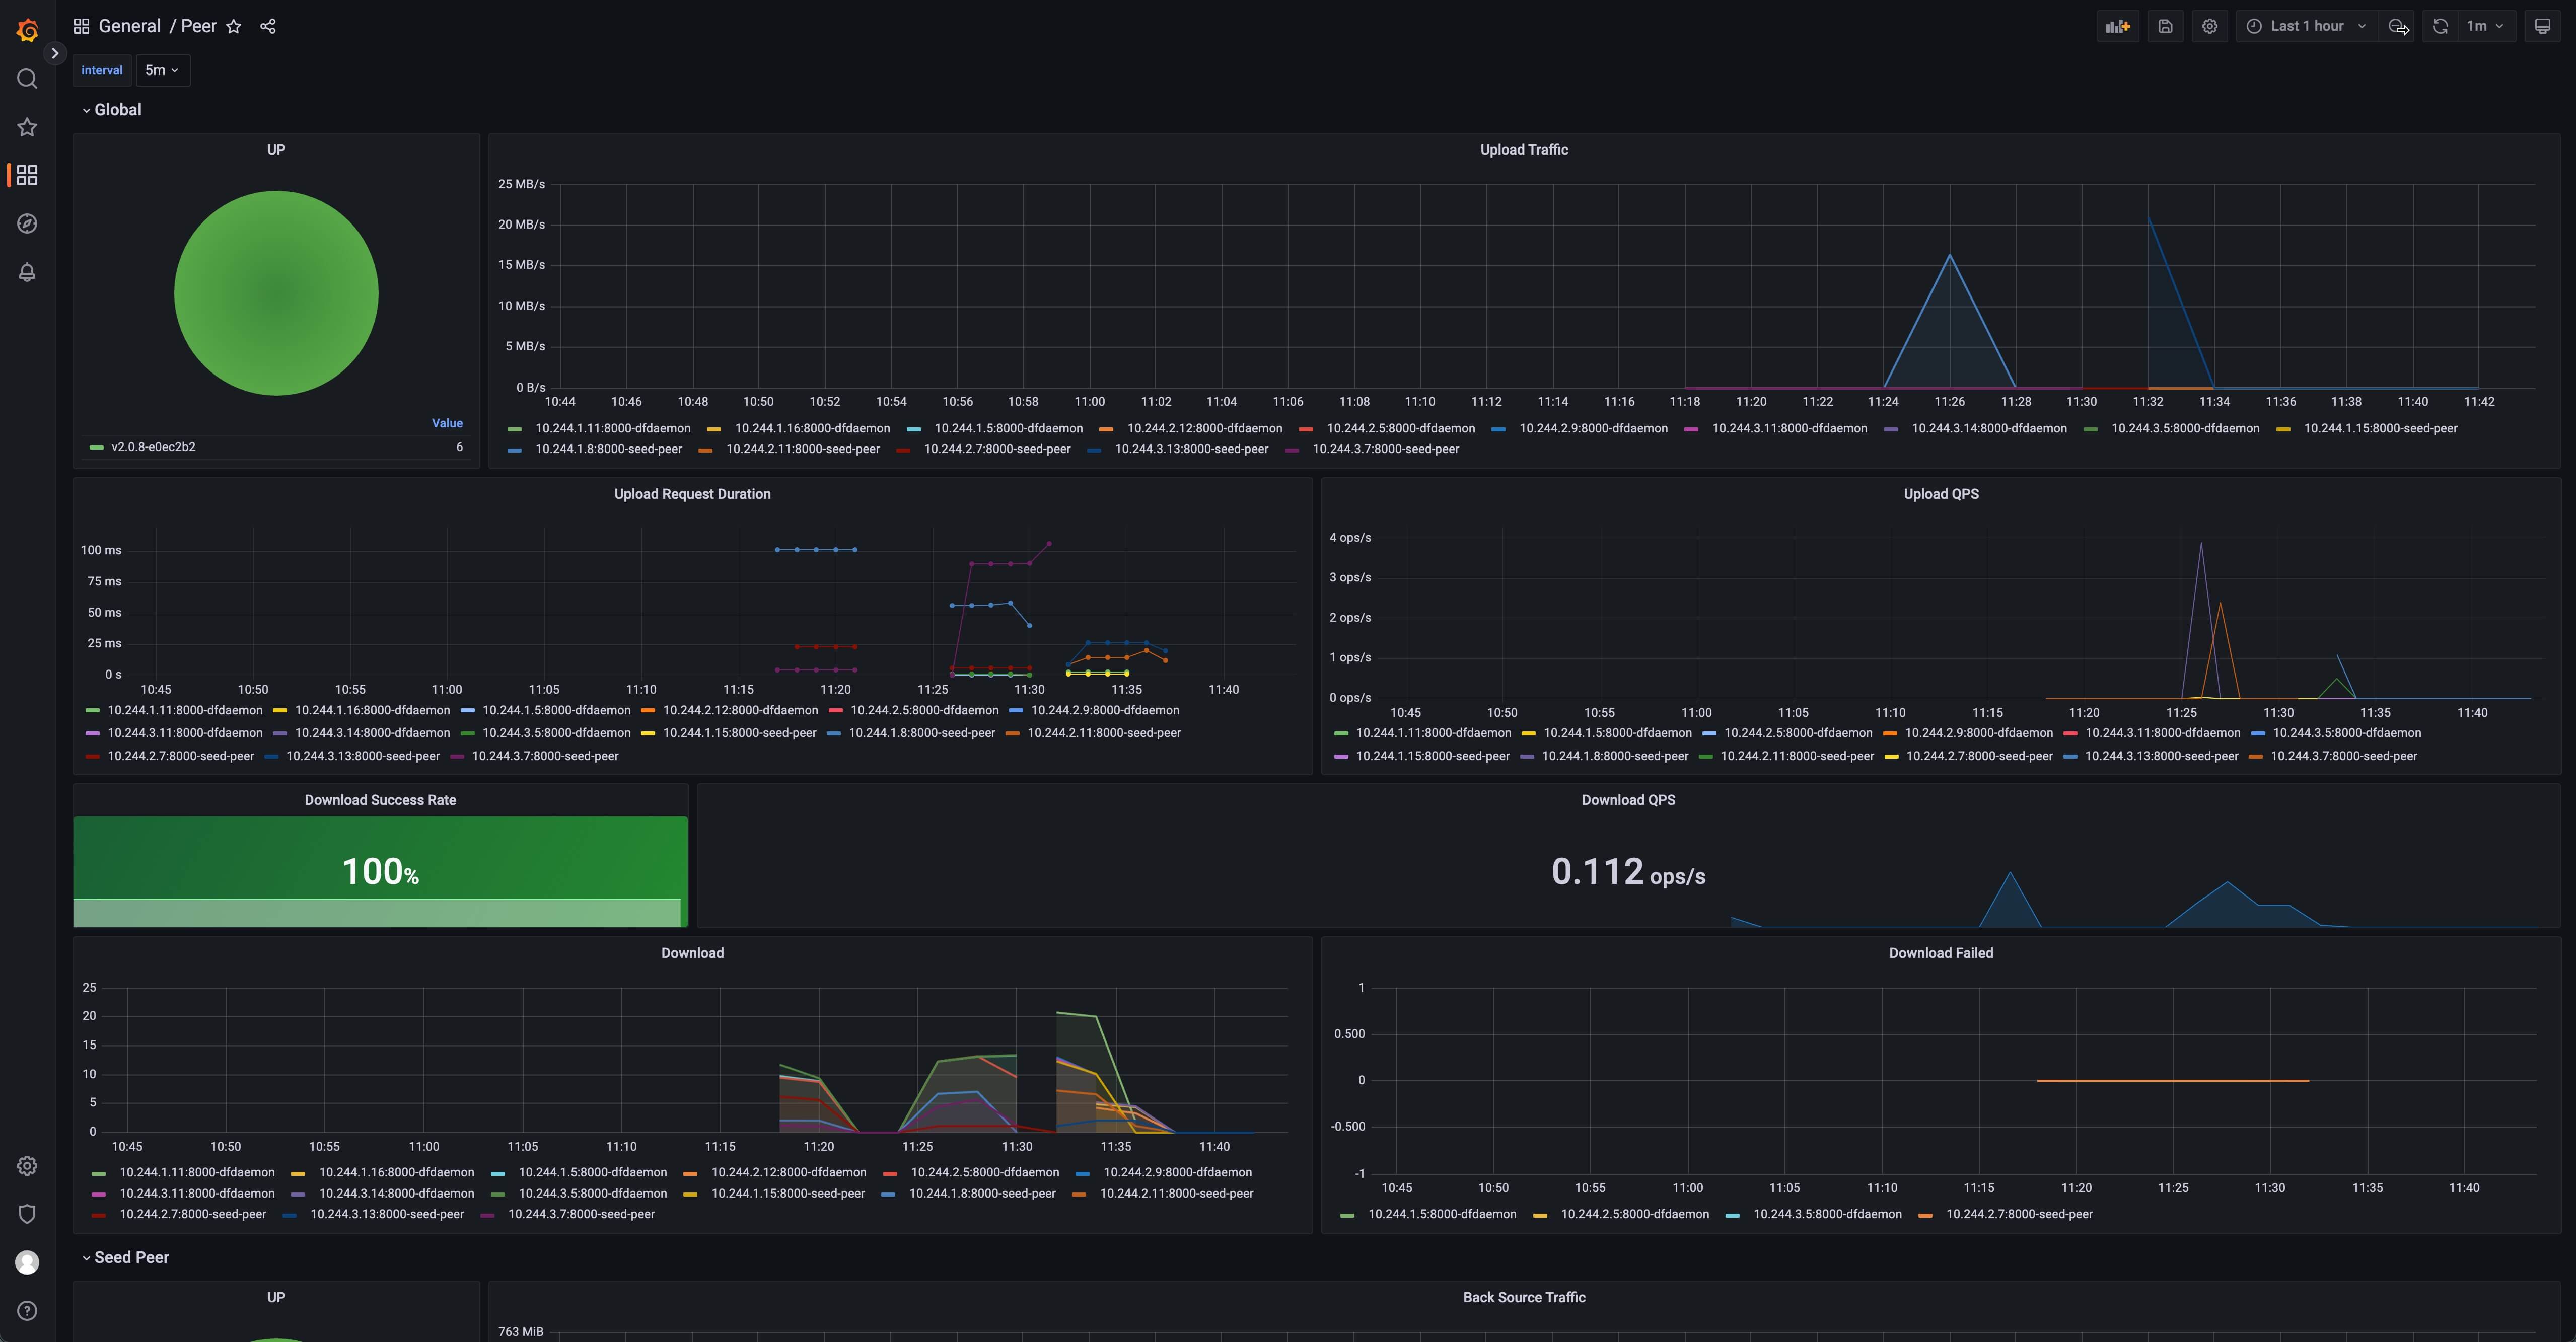
Grafana dashboards are published in grafana.com, and the address of the dashboards are Manager, Scheduler and Peer.
The following dragonfly monitoring example is based on kubernetes, and uses the prometheus-community/kube-prometheus-stack charts to deploy prometheus and grafana.
Step 1: Install prometheus and grafana
Install prometheus and grafana based on kube-prometheus-stack
- Get Repo Info
helm repo add prometheus-community https://prometheus-community.github.io/helm-charts
helm repo update
- Install kube-prometheus-stack charts
helm install prometheus prometheus-community/kube-prometheus-stack -f https://raw.githubusercontent.com/dragonflyoss/monitoring/main/prometheus/values.yaml
- Expose the grafana port at address
localhost:8080
kubectl port-forward svc/prometheus-grafana 8080:80
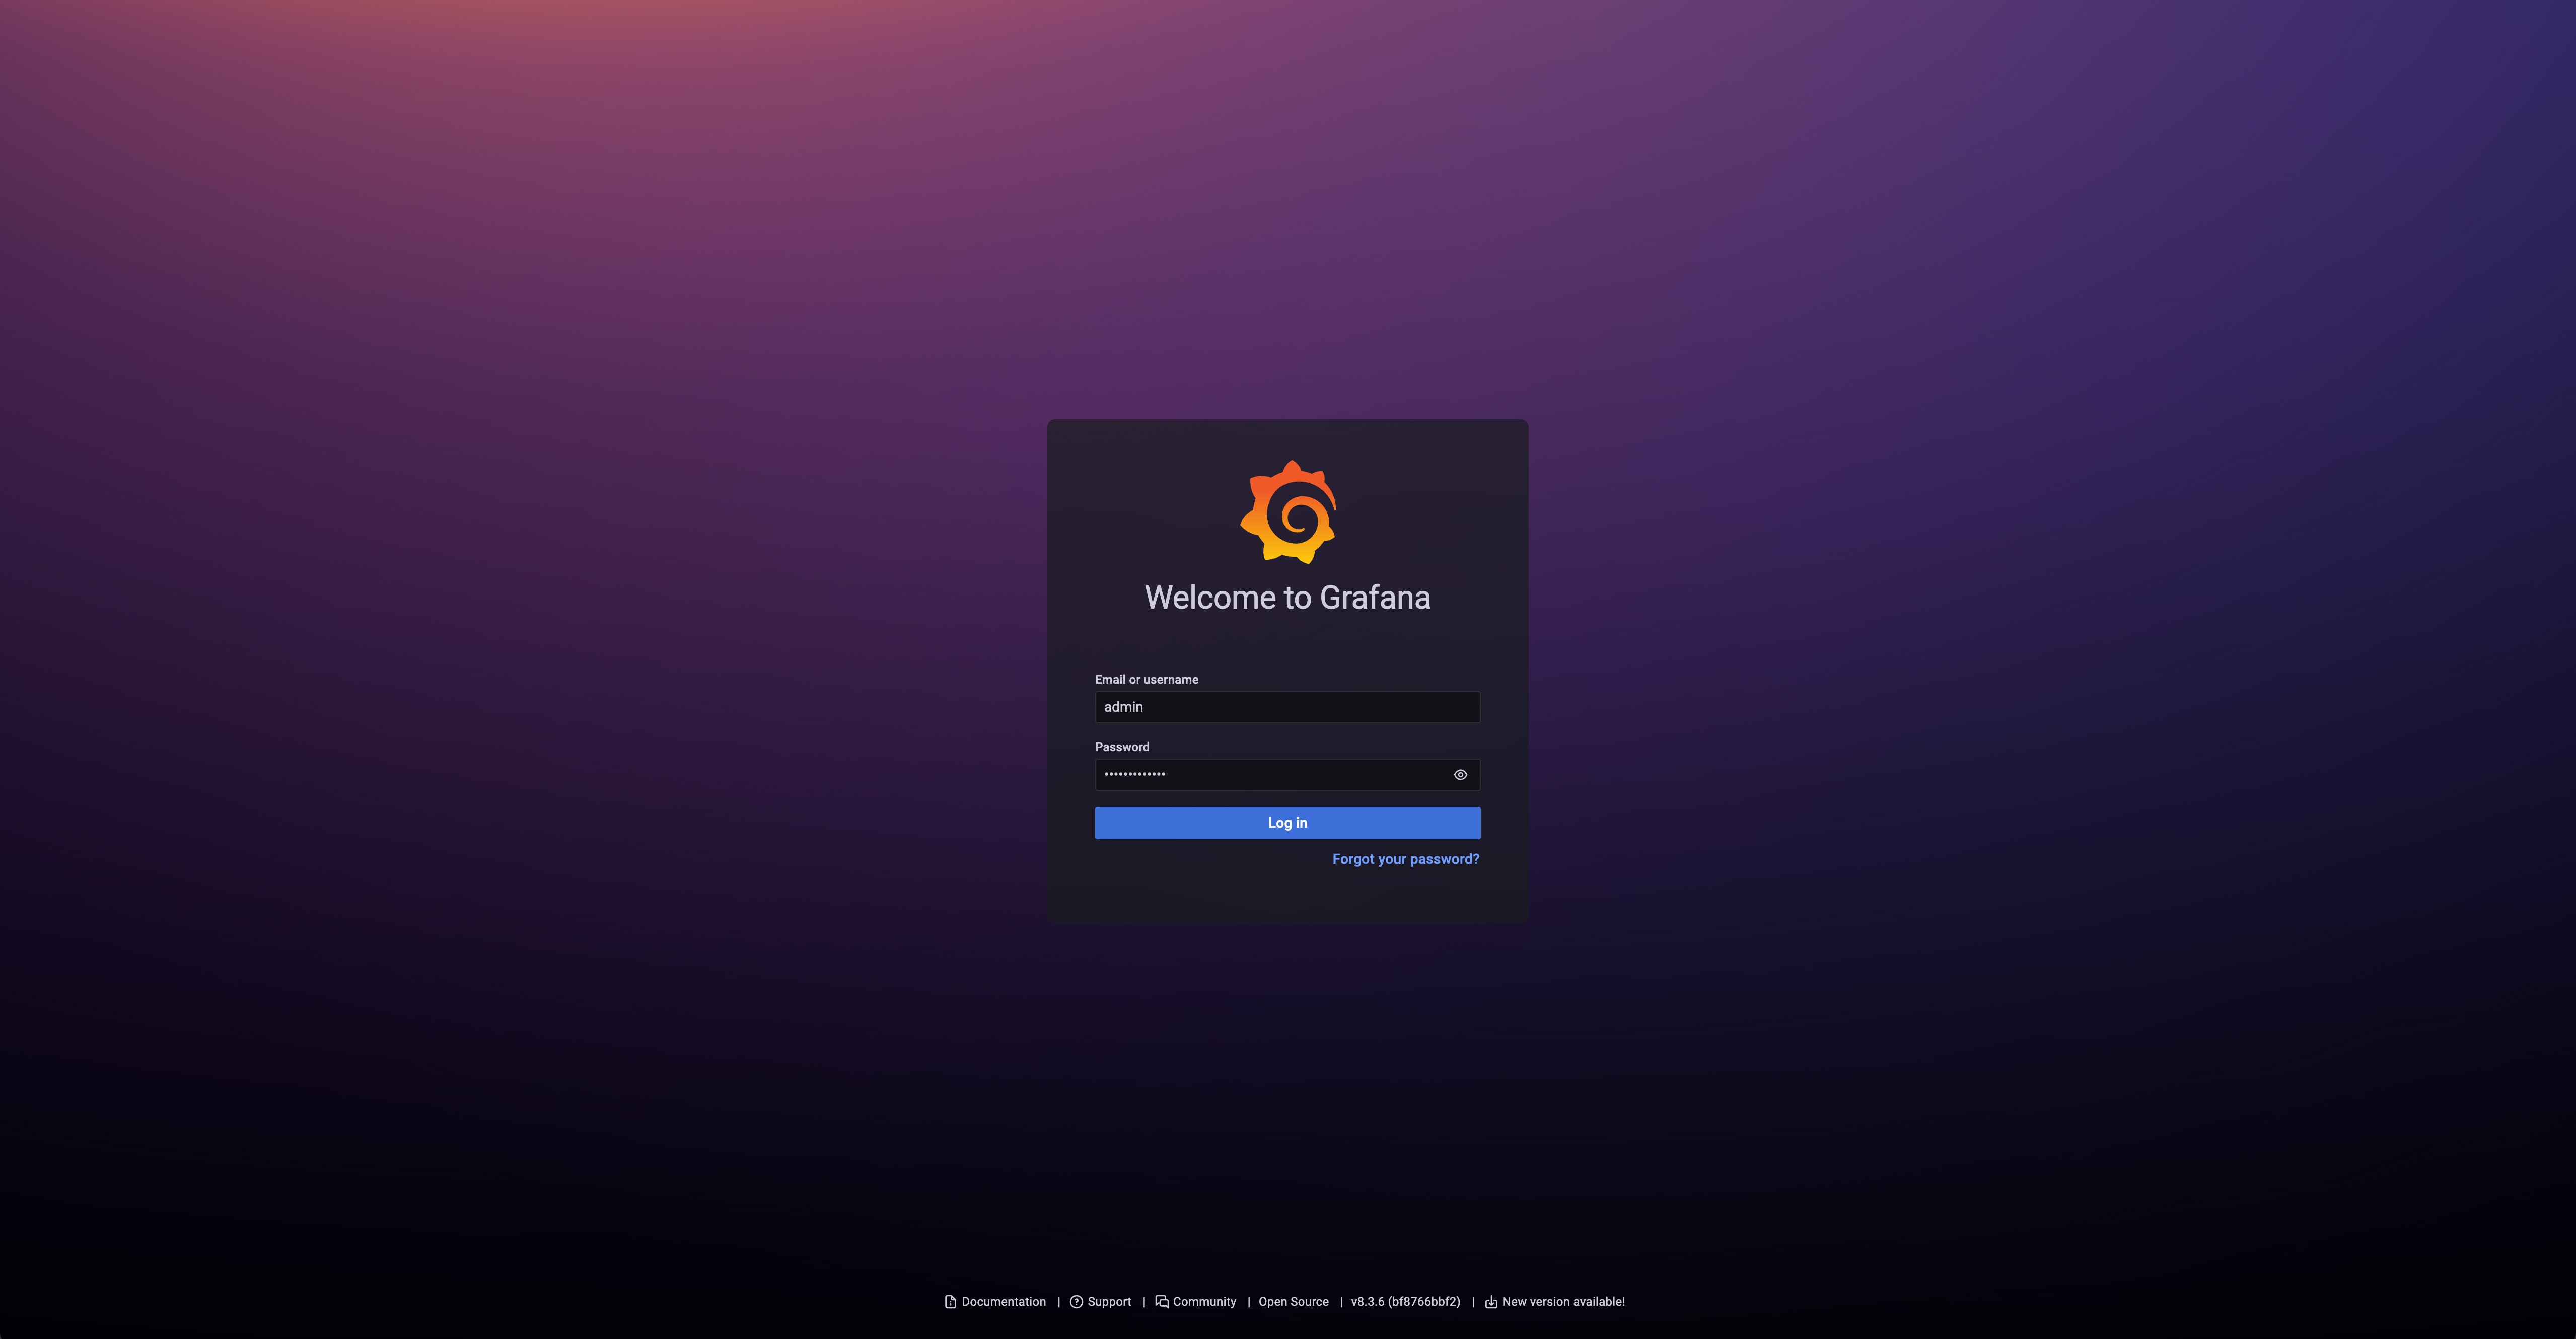
- Visit address
localhost:8080to see the grafana dashboard. You can login with usernameadminand passwordprom-operator
Step 2: Install dragonfly with ServiceMonitor
Install dragonfly based on dragonfly.
- Get Repo Info
helm repo add dragonfly https://dragonflyoss.github.io/helm-charts/
helm repo update
- Configure dragonfly charts with
ServiceMonitor, refer to serviceMonitor in chart values. Generate dragonfly charts configurationvalues.yamlis as follows:
scheduler:
 image:
    repository: dragonflyoss/scheduler
    tag: latest
  metrics:
    enable: true
    serviceMonitor:
      enable: true

seedPeer:
  enable: true
  image:
    repository: dragonflyoss/dfdaemon
    tag: latest
  metrics:
    enable: true
    serviceMonitor:
      enable: true

dfdaemon:
  enable: true
  image:
    repository: dragonflyoss/dfdaemon
    tag: latest
  metrics:
    enable: true
    serviceMonitor:
      enable: true

manager:
  image:
    repository: dragonflyoss/manager
    tag: latest
  metrics:
    enable: true
    serviceMonitor:
      enable: true
- Install dragonfly charts with
ServiceMonitor
helm install --create-namespace --namespace dragonfly-system dragonfly dragonfly/dragonfly --version 1.1.45 -f values.yaml
Step 3: Validate metrics
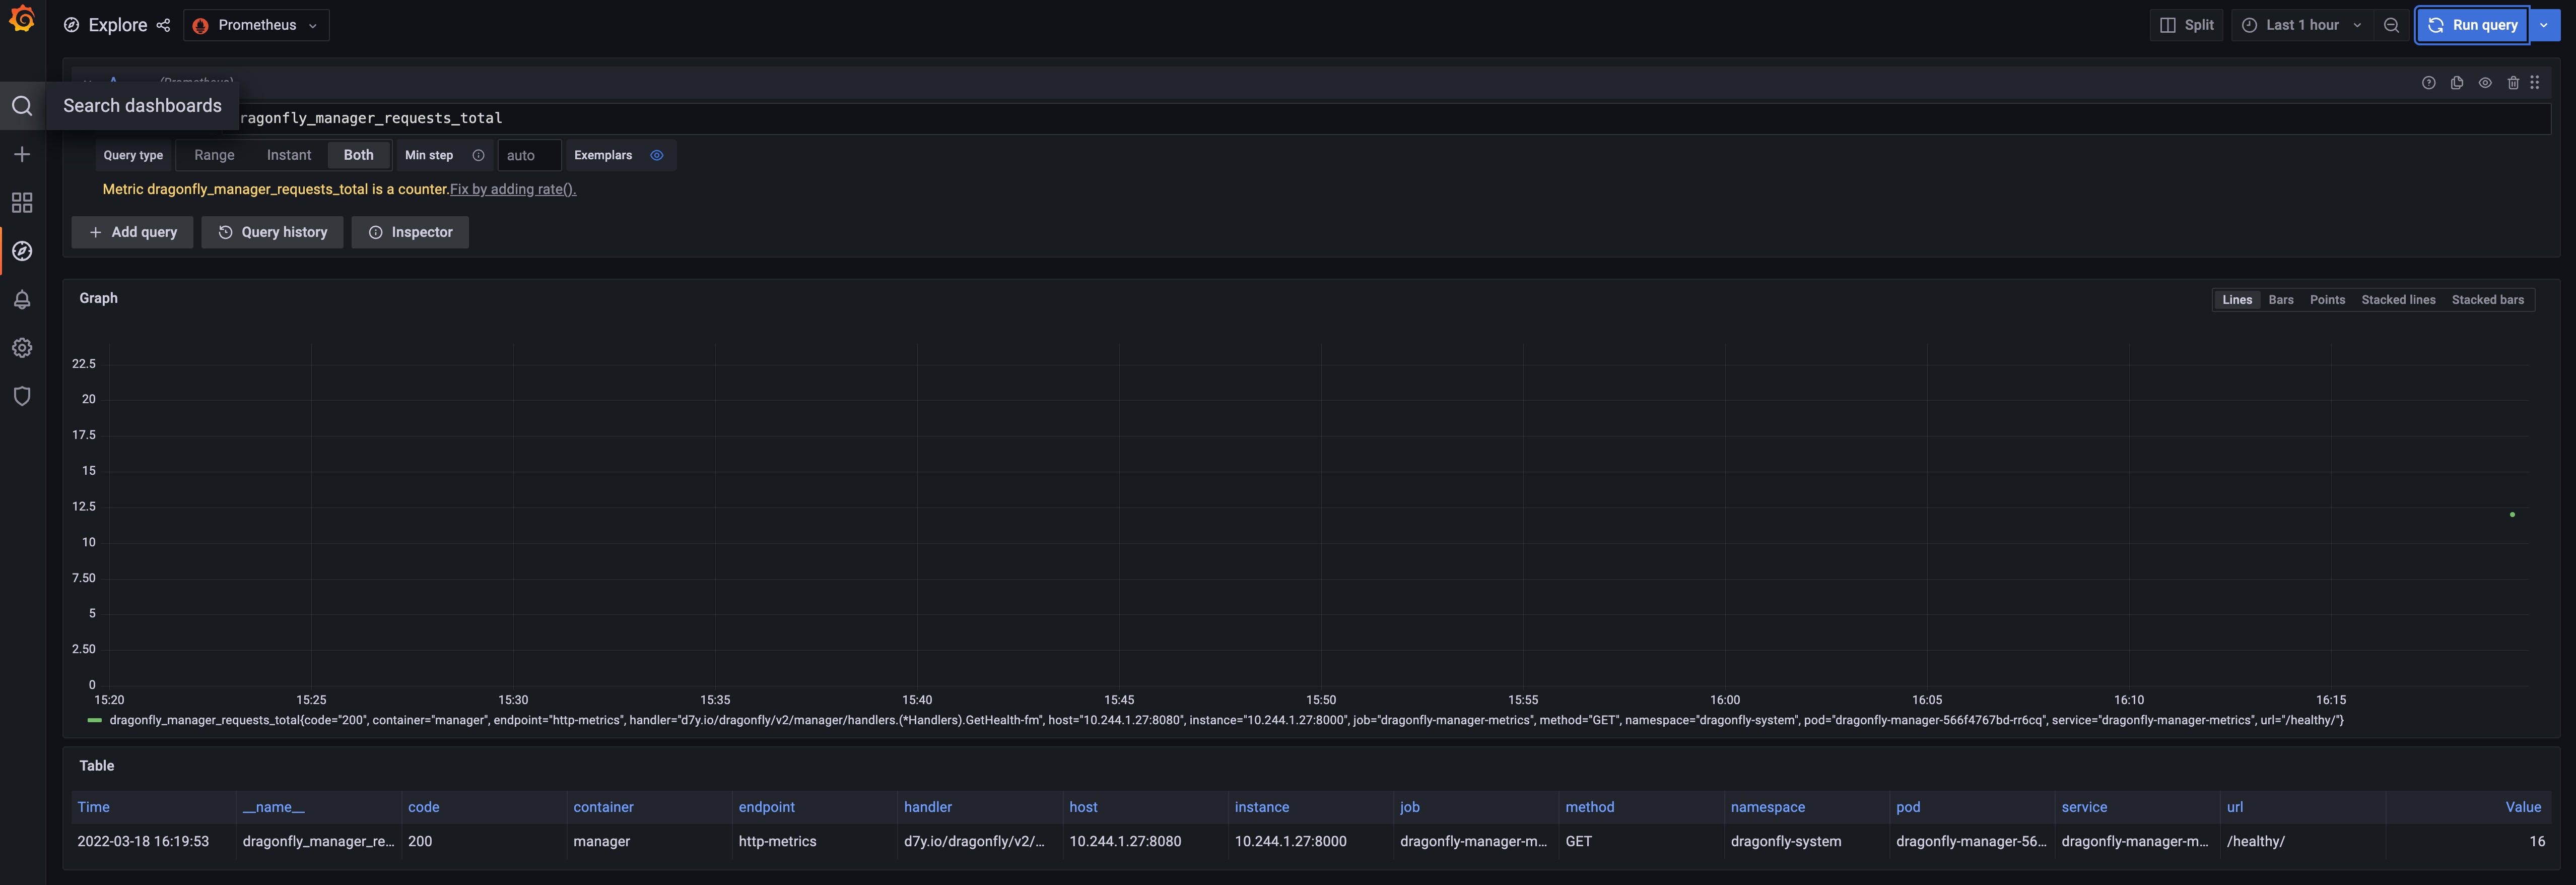
Visit grafana explore page at localhost:8080/explore and
query dragonfly_manager_requests_total to validate that dragonfly metrics have been collected.
Step 4: Import dragonfly grafana dashboards
Dragonfly grafana dashboard info is:
| Name | ID | Link | Description |
|---|---|---|---|
| Dragonfly Manager | 15945 | https://grafana.com/grafana/dashboards/15945 | Grafana dashboard for dragonfly manager. |
| Dragonfly Scheduler | 15944 | https://grafana.com/grafana/dashboards/15944 | Grafana dashboard for dragonfly scheduler. |
| Dragonfly Peer | 15946 | https://grafana.com/grafana/dashboards/15946 | Grafana dashboard for dragonfly peer. |
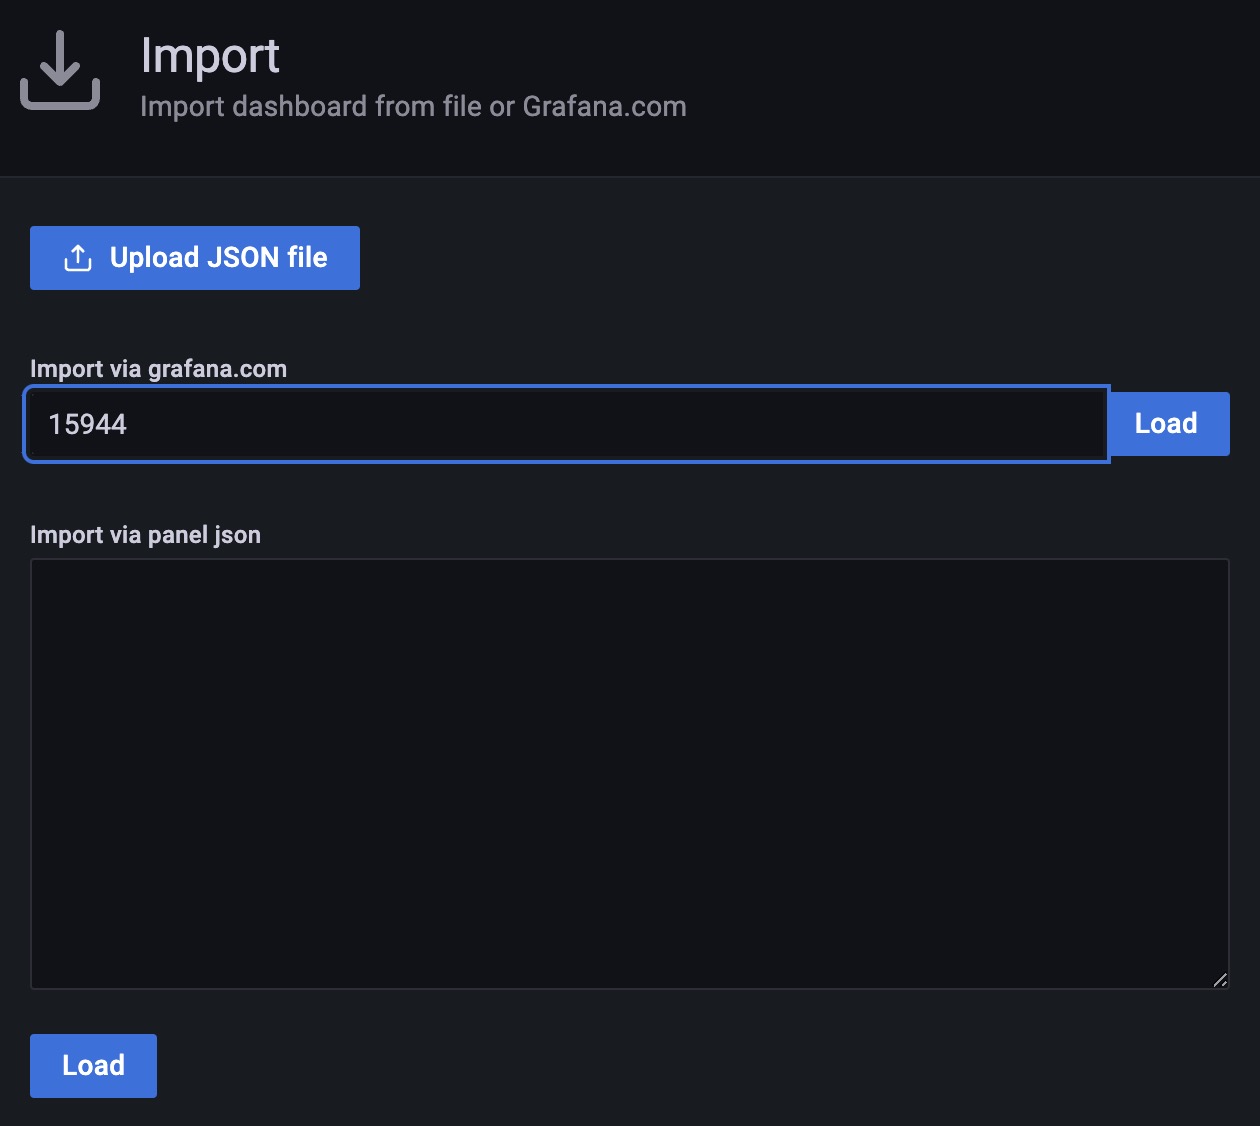
- Import dragonfly grafana dashboard using ID, IDs are
15945,15944and15946, refer to export-import
- Import dragonfly grafana dashboard successfully, you can visit the dashboard